A clear and data-driven overview of how your offices are actually being used.
Branch Occupancy Reporting provides companies with extensive branch networks a clear, visual, and data-driven overview of how their offices and branches are actually being used. Through automated monitoring, visualizations, and reports, it helps optimize real estate costs and improve strategic decision-making in space planning.
Lack of centralized data on branch occupancy
Unreliable decision-making without real figures on space utilization
Time zone complications in global operations
Distinguishing real users from passive devices
Missing visualizations and clear analytics dashboards
Daily time zone–correct reporting for global overviews to see accurate branch utilization vs. real capacity.
Cross-branch overviews with comparison capabilities – easily compare the busiest branches with the least utilized ones.
Clear charts reporting branch utilization, network device utilization, and a comprehensive overview in a single heatmap. Everything exportable to PDF/XLS.
Implemented logic for user deduplication and filtering out non-user devices such as printers, tablets in meeting rooms, etc. – one real person = one account.
Integrate with ServiceNow, Cisco Meraki, Cisco DNAC and automated data updates between these systems. Secure SSO and user access management.
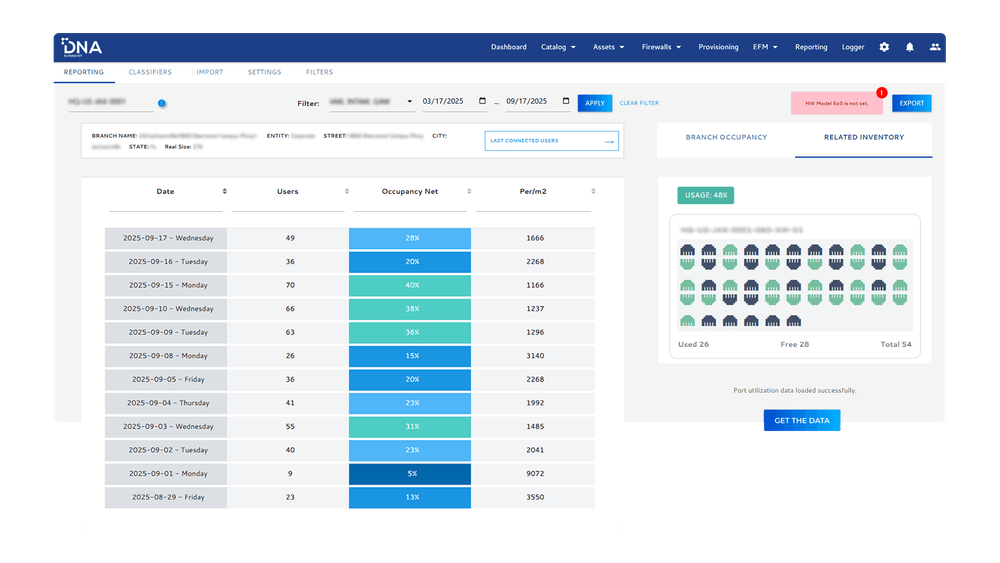
✔️ Data-driven decision-making
Strategic planning based on real occupancy data.
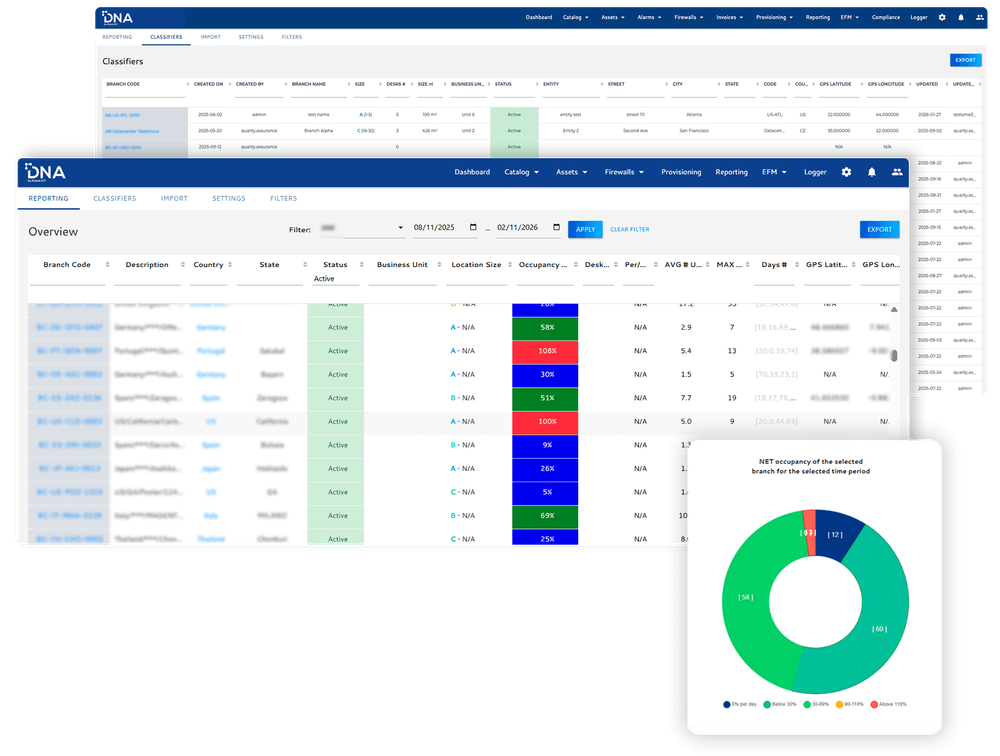
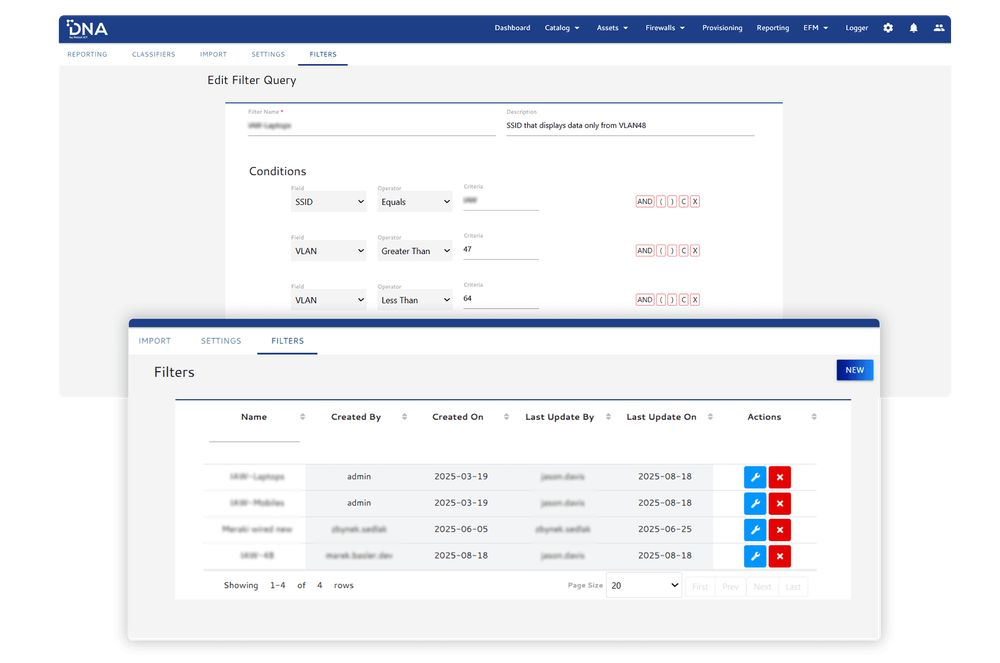
📊 Transparent reporting
Clear visibility into branch utilization, presented not only as numbers but also visually.
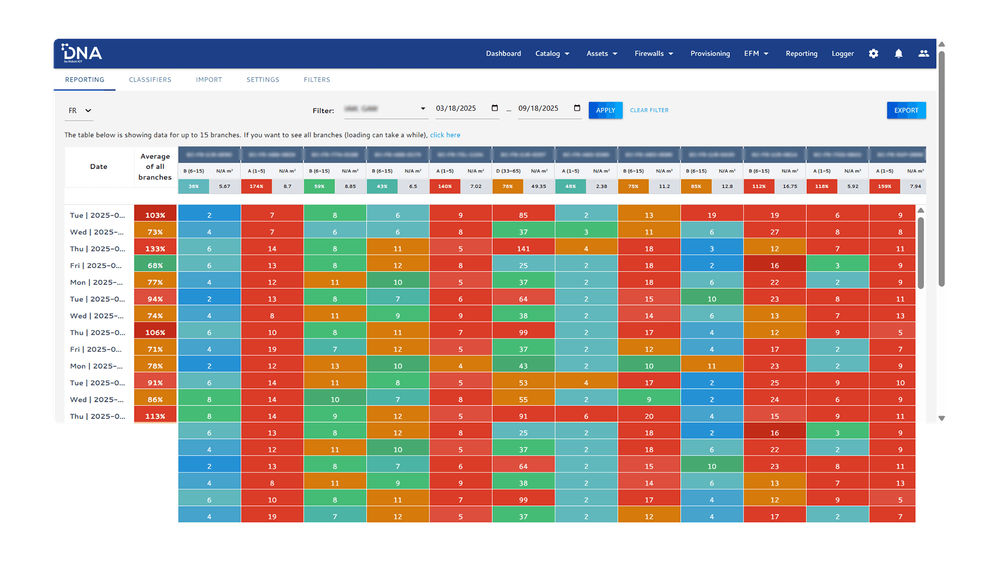
💰 Significant cost savings
Reduction of redundant space thanks to accurate insights into actual usage.
🔒 Robust, secure, and scalable solution
Enterprise-ready reporting with 24/7 availability and high accuracy.
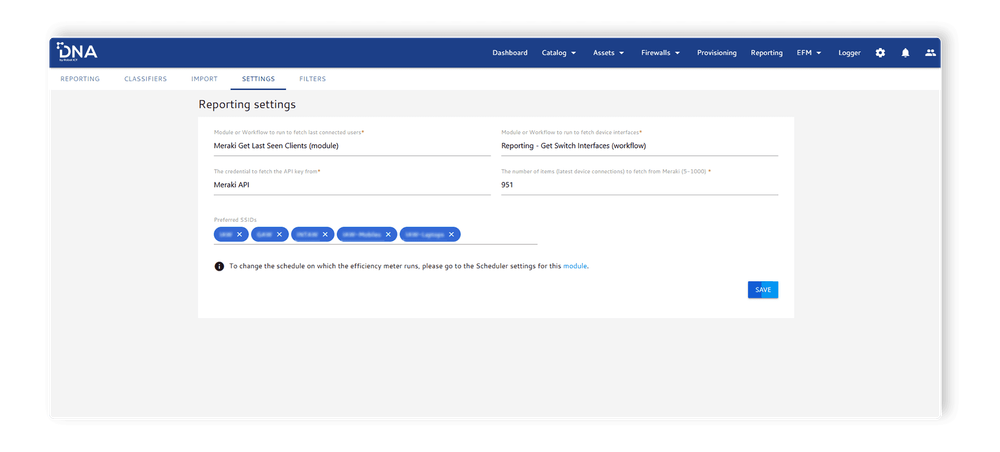
🚀 Improved operational efficiency
Automated insights reduce manual analysis and speed up capacity planning.
A global company with an extensive branch network needs to decide on office space optimization but lacks reliable data on actual utilization.
By using this solution we automatically collect network data and visualizes occupancy data across all locations. Management gains clear insight into underutilized and overloaded branches and can make decisions based on data rather than assumptions.
The result is reduced real estate costs and more efficient use of workspace.
The solution is including integration with:
And can be easily integrated with much more 3rd party SW!
Global Companies with ~5.000+ employees and ~50+ branches, regardless of the industry in which it operates.
Companies with high real estate portfolio costs that are seeking to optimize office space and hybrid working models.
Management that wants clear reports on how office space is being used. IT teams that want clear data on the utilization of network devices in offices for necessary optimization.